


Two homeowners can pursue an identical net-zero home renovation, insulation, a heat pump, and a solar array sized for the same square footage, and end up with project costs tens of thousands of dollars apart, purely based on their ZIP code. Understanding net-zero renovation cost by state matters because geography drives three separate cost factors simultaneously: local labor rates, climate-driven technical requirements, and the wildly uneven landscape of state and utility rebates that now matters more than ever since the federal solar and efficiency tax credits expired at the end of 2025.
Regional variation in general home renovation pricing is already substantial, with cost multipliers swinging from roughly 17 percent below the national average in lower-cost metros to 30 percent above it in expensive coastal markets. A net-zero renovation cost by state comparison layers additional variables on top of that baseline swing: California’s Title 24 energy code and solar mandate, Florida’s hurricane-resistant construction requirements, and the sheer difference in solar installation pricing between union-labor Northeast markets and non-union Sun Belt states all shift the total project cost considerably, sometimes by tens of thousands of dollars for functionally identical scopes of work.
This guide walks through the complete picture of net-zero renovation cost by state — the regional labor and material cost multipliers driving baseline pricing, how climate zone shapes technical requirements and their cost, the real swing in solar installation pricing coast to coast, why state and utility rebates now matter more than a uniform federal credit ever did, and representative cost comparisons across several distinct regional markets.
What Drives Net-Zero Renovation Cost Differences by State?
Net-zero renovation cost by state varies primarily due to three factors: regional labor and permitting costs, climate zone requirements, and the availability of state or utility incentive programs. Regional construction cost multipliers alone create a documented 49 percent differential between the least and most expensive state markets, with the Northeast and West Coast commanding 25 to 45 percent premiums over South Central states due to cumulative regulatory requirements and higher labor rates.
Solar installation costs specifically range from roughly 2.35 to 3.35 dollars per watt depending on state, a swing driven by union versus non-union labor markets, permitting timelines, and local demand. Since the federal 25C and 25D tax credits expired for property placed in service after December 31, 2025, state-level rebates and utility incentive programs now account for a larger share of the total cost difference between states than at any point since 2022.
1. Regional Cost Multipliers: Why the Same Renovation Costs Different Amounts
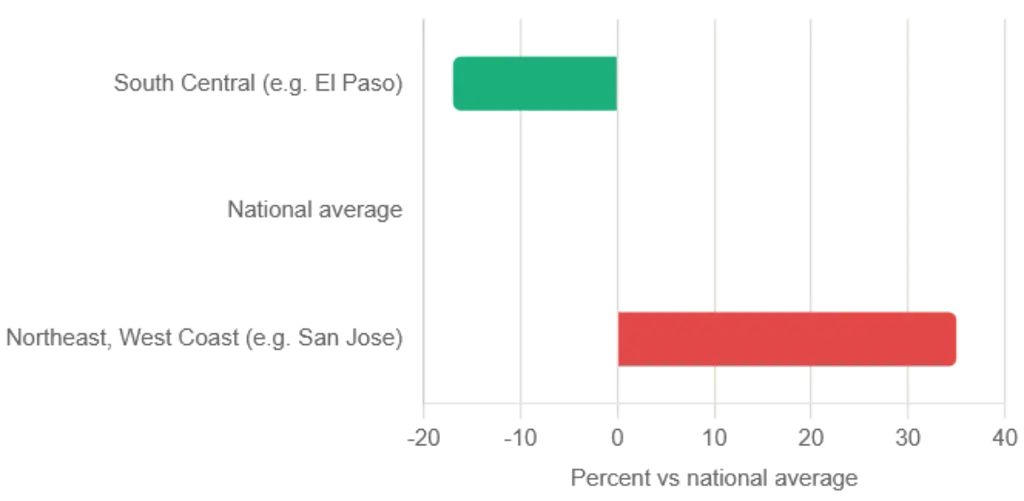
Before climate or solar factors even enter the picture, net-zero renovation cost by state starts with baseline construction and labor pricing that varies enormously across the country. National data spanning dozens of metro areas shows regional cost multipliers ranging from roughly 17 percent below the national average in lower-cost markets like El Paso up to 30 percent above it in expensive coastal metros like San Jose, a swing that applies to virtually every trade involved in a net-zero renovation, from framing carpenters to electricians to HVAC installers.
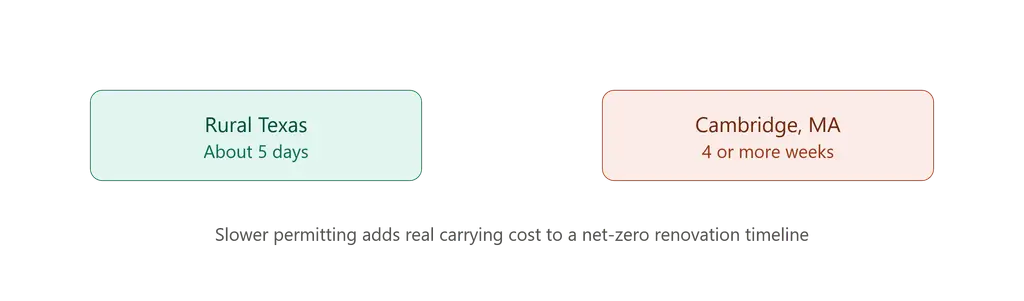
Labor cost differences alone illustrate how significant this variation becomes at the individual trade level. Electricians in union-heavy Northeast markets like Boston commonly charge in the range of 85 dollars per hour, compared to roughly 55 dollars per hour in non-union Sun Belt markets like Houston, a difference that compounds across every electrical task a net-zero renovation requires, from panel upgrades to new circuits for heat pumps and EV chargers. Permitting timelines add a further layer of regional variation: a permit that takes roughly five days to process in rural Texas can take four weeks or longer in a dense, heavily regulated market like Cambridge, Massachusetts, a delay that carries real carrying costs for homeowners and contractors alike.
These labor and permitting differences do not stay isolated to a single trade; they compound across an entire net-zero renovation scope. A project involving insulation contractors, electricians, HVAC installers, and solar crews accumulates the regional cost premium or discount at every single stage, meaning the cumulative gap between a high-cost and low-cost market can end up considerably larger than any single trade’s hourly rate difference would suggest on its own. Homeowners comparing quotes from contractors in different regions, or relocating a planned renovation from one state to another, should expect this compounding effect to show up clearly in the final bid.

2. Climate Zone: The Biggest Technical Driver of Regional Cost
Beyond labor and permitting, net-zero renovation cost by state is shaped directly by climate zone, since the technical requirements for reaching net-zero performance differ substantially between a home in Minnesota and one in Arizona. Colder climates require thicker insulation assemblies and higher-performance glazing to manage extreme winter heat loss, while humid climates require more aggressive vapor control and cooling-focused solar management to manage moisture and cooling loads rather than heating loads. These variations directly affect labor hours, construction sequencing, and how many trades need to coordinate to maintain a continuous, high-performance building envelope.
Site-specific climate conditions compound this variation further within the same general climate zone. Lots with poor solar access, whether from tree cover, shading from neighboring structures, or unfavorable roof orientation, require either a higher-performing building envelope to compensate or a larger renewable energy array to make up the difference, both of which add cost. Local labor familiarity with high-performance construction detailing also matters considerably: regions where trades already have experience with airtight assemblies and continuous insulation tend to see smaller cost premiums for net-zero-specific work, since contractors already understand how to sequence the necessary transitions and testing without the trial-and-error costs a less experienced market would incur.
3. Solar Cost by State: A Full Dollar Swing Coast to Coast

Nowhere is net-zero renovation cost by state variation clearer than in solar installation pricing. In 2026, installed solar costs range from roughly 2.35 dollars per watt in lower-cost states like Texas up to 3.35 dollars per watt in higher-cost states like Massachusetts, a full dollar-per-watt swing that translates into a meaningful difference on a typical residential system. That gap breaks down into several component categories: equipment costs vary modestly by 10 to 20 percent between value and premium panel and inverter brands, but labor costs vary far more dramatically, tracking the same union versus non-union wage differences documented across every other trade in a net-zero renovation.
On a typical residential system sized in the range of 8 to 10 kilowatts, that dollar-per-watt swing translates into a difference of roughly 8,000 to 10,000 dollars between the least and most expensive states, a gap that exists before any state-specific rebate or incentive is even factored in. For homeowners weighing whether to prioritize solar early or late in a renovation timeline, understanding this baseline state-level cost swing matters just as much as understanding the technical sequencing logic that governs when solar should be installed relative to envelope and mechanical work.
The expiration of the federal Residential Clean Energy Credit at the end of 2025 has made this state-level variation matter considerably more than it did previously. A homeowner purchasing solar with cash or a loan in 2026 receives zero federal tax credit, a genuinely significant shift from the 30 percent credit available through 2025, which means the underlying state-level cost differential in net-zero renovation cost by state comparisons is no longer partially offset by a uniform national subsidy. State incentives, lease and power purchase agreement financing options, and net metering policy differences have become the primary levers homeowners in different states now use to manage solar costs, rather than a shared federal baseline.
4. State and Local Rebates: The New Deciding Factor
With the federal 25C and 25D credits expired, the availability and generosity of state and utility rebate programs has become one of the single largest variables in net-zero renovation cost by state comparisons. States that moved quickly to fund their HEAR and HOMES rebate allocations under the 2022 Inflation Reduction Act, along with states carrying independently funded utility efficiency programs, offer homeowners meaningfully lower effective costs than states where these programs remain underfunded or slow to roll out. A homeowner in a state with an actively funded rebate program and a utility offering strong solar net metering can face a genuinely different effective cost than a homeowner in a state without either.
Local utility rate structures add a further wrinkle specific to certain markets. Some utilities have begun implementing demand charges that bill customers based on their highest usage window each day rather than total consumption alone, a structure that can add real monthly cost for an unoptimized home even without any change in total energy use. In markets with this kind of rate structure, battery storage paired with solar becomes a more consequential part of a net-zero renovation than it would be in a state with flat, straightforward net metering, adding another layer of state-specific cost variation to the overall project budget.
5. Regional Case Studies: How the Numbers Actually Differ
Looking at specific regional examples makes net-zero renovation cost by state variation concrete rather than abstract. California carries some of the highest baseline construction costs in the country, driven partly by Title 24 energy code compliance, California Environmental Quality Act review requirements, and the state’s residential solar mandate, cumulative regulatory factors that can add tens of thousands of dollars to a standard construction budget before any net-zero-specific scope is even considered, on top of a baseline cost per square foot well above the national average.
Florida presents a different cost driver entirely: post-Hurricane Andrew building code revisions require new construction and major renovation work in High Velocity Hurricane Zones to withstand extremely high wind loads, requiring impact-resistant windows that carry a meaningful cost premium over standard glazing, along with reinforced roof-to-wall connections and engineered foundation systems, collectively adding a real percentage to construction costs in coastal counties.
Nevada offers yet another regional pattern, where newer utility demand-charge structures in the Las Vegas market have shifted net-zero renovation cost strategy toward battery storage and peak-shaving rather than solar generation alone, a locally specific consideration that would not factor into a similar project in a state without comparable rate structures. Texas and other South Central states, by contrast, benefit from comparatively lower baseline construction costs, non-union labor markets, and faster permitting timelines, all of which reduce the effective cost of an equivalent net-zero scope of work relative to coastal markets.
These regional patterns rarely operate in isolation on any single project. A homeowner in coastal Florida pursuing a net-zero renovation cost is simultaneously managing hurricane code compliance costs and the state’s specific solar interconnection rules, while a California homeowner is managing Title 24 compliance alongside some of the country’s highest labor rates. Recognizing which regional cost drivers actually apply to a specific project, rather than assuming national average figures translate directly to a local market, is often the single most useful step a homeowner can take before requesting contractor bids.

Key Facts: Net-Zero Renovation Cost by State at a Glance
| Factor | Detail |
| Regional construction cost differential | Up to 49 percent between lowest and highest states |
| Northeast, West Coast premium | 25 to 45 percent above South Central states |
| Electrician hourly rate, high-cost market | Approximately 85 dollars per hour (Boston) |
| Electrician hourly rate, lower-cost market | Approximately 55 dollars per hour (Houston) |
| Solar cost per watt, lower end | Approximately 2.35 dollars per watt |
| Solar cost per watt, higher end | Approximately 3.35 dollars per watt |
| Federal solar and efficiency tax credits | Expired for property placed in service after Dec 31, 2025 |
| California added regulatory cost | Roughly 25,000 to 45,000 dollars |
| Florida impact window premium | Roughly 12,000 to 18,000 dollars |
| Permit timeline, faster market | About 5 days (rural Texas) |
| Permit timeline, slower market | About 4 or more weeks (Cambridge, MA) |
Frequently Asked Questions About Net-Zero Renovation Cost by State
Why does net-zero renovation cost by state vary so much?
Understanding net-zero renovation cost by state starts with recognizing that it varies due to regional labor and permitting cost differences, climate zone requirements that change insulation and mechanical sizing, and the availability of state or utility rebate programs, which now matter more than ever since the federal 25C and 25D tax credits expired at the end of 2025.
Which states have the highest net-zero renovation costs?
Coastal states with high labor costs and complex regulatory environments, including California, Massachusetts, and other Northeast and West Coast markets, typically show the highest net-zero renovation cost by state figures, driven by union labor rates, energy code compliance requirements, and slower permitting timelines.
How much does solar cost vary by state in 2026?
Installed solar costs in 2026 range from roughly 2.35 dollars per watt in lower-cost states to 3.35 dollars per watt in higher-cost states, a difference driven primarily by labor market structure, permitting speed, and local demand, a meaningful component of overall net-zero renovation cost by state variation.
Do state rebates make up for the expired federal tax credit?
In some states, yes. States with well-funded HEAR and HOMES rebate programs and strong utility efficiency incentives can offset a meaningful share of the 30 percent federal credit that expired at the end of 2025, but coverage varies enormously, making net-zero renovation cost by state research essential before budgeting a project.
Does climate zone affect net-zero renovation cost?
Yes. Colder climates require thicker insulation and higher-performance windows to manage heat loss, while humid and hot climates require different vapor control and cooling strategies, both of which shift labor hours and material costs, making climate zone one of the central factors in net-zero renovation cost by state differences.
Is it cheaper to do a net-zero renovation cost in a Sun Belt state?
Generally, yes. South Central and Sun Belt states typically combine lower baseline construction costs, non-union labor markets, and faster permitting timelines, all of which tend to reduce the effective net-zero renovation cost by state relative to coastal Northeast and West Coast markets for a comparable scope of work.
Related Posts from Architecture Associate
- Net-Zero Home Renovation: Complete Guide to Costs & ROI
- How to Convert an Existing Home to Net-Zero Energy
- Camp Meeker Cabin: 3 Sleeping Nooks, Zero Carbon
- Basics of Light: 7 Bold Concepts Every Architect Needs
Explore more sustainable design and renovation cost guides in the Architecture category on Architecture Associate.
External References
- NuWatt Energy, Solar Cost by State 2026: nuwattenergy.com
- Cost to Renovate, Home Renovation Cost Report 2026: costtorenovate.com
- Build Folio, Home Improvement Costs by State: build-folio.com
Final Thoughts
Net-zero renovation cost by state is never a single number, and treating it as one is the fastest way to budget a project incorrectly. Regional labor and permitting costs alone create a documented 49 percent swing between the cheapest and most expensive markets, climate zone shifts the technical scope of the work itself, and the loss of a uniform federal tax credit has made state and utility rebate research a genuinely necessary step rather than an optional bonus.
Homeowners planning a net-zero renovation should treat their specific state and local utility territory as a primary input into the budgeting process from day one, not an afterthought layered on once national average figures have already anchored their expectations. The same scope of work, sized for the same home, can cost tens of thousands of dollars more or less depending entirely on where that home happens to sit.